Azure Landing Zones and the Azure Monitor Baseline Alerts
 Stephen Tulp
February 19, 2024
5 minutes to read
When deploying resources into a cloud platform it is critical to have an understanding and visibility into deployed resources to be able to address the four (4) golden signals of monitoring
- Latency: Time required to fulfil a request
- Traffic: Number of hits per second
- Saturation: % of resources consumed
- Errors: Request failure rates
Platform observability and monitoring is for monitoring and troubleshooting, proactive issue detection, capacity planning and optimization, security and compliance and continual improvement of workloads
Platform Observability Overview
Platform observability refers to the ability to monitor and understand the state of a system or platform by examining its outputs. It’s a measure of how well internal states of a system can be inferred from knowledge of its external outputs.
In the context of software development and operations, platform observability typically involves collecting and analyzing metrics, logs, and traces from various parts of a system to gain insight into its performance, reliability, and behavior. This can help in identifying issues, understanding their root cause, and optimizing system performance.
Key components of platform observability include:
- Metrics: These are numerical values that represent the state of a system at a point in time. They can be used to track and alert on system health and performance.
- Logs: These are detailed records of events that have occurred within a system. They can provide context for troubleshooting and debugging issues.
- Traces: These provide a detailed view of a request’s path through a system. They can be used to identify performance bottlenecks and understand system dependencies.
- Alerts: These are notifications triggered by specific conditions in the system. They can help in proactively identifying and addressing issues.
- Visualization: This involves using tools and dashboards to visualize the data collected, making it easier to understand and interpret.
Observability vs Monitoring
So what is the difference? Monitoring is the process of collecting data and generating reports on different metrics that define system health. Observability is a more investigative approach. It looks closely at distributed system component interactions and data collected by monitoring to find the root cause of issues.
Azure Monitor Baseline Alerts
The Azure Monitor Baseline Alerts (AMBA) initiative is a Microsoft Open Source project to provide best practice guidance around key alerts metrics and their thresholds.
This project consists of two main sections:
-
Services: Provides guidance for individual Azure services. For each service, there is a list of key alert metrics and the recommended thresholds.
-
Patterns: Provides guidance for common patterns, like Azure Landing Zones, as well as policy definition and initiatives for deploying the alerts in your environment.
An Azure Landing Zone (ALZ) is as a common set of Azure resources/services that are configured in a similar way across an organizations. The ALZ pattern provides an example of how to monitor-at-scale while leveraging Infrastructure-as-code principles. The opinionated view on what you should monitor for Platform and Application Landing Zones include:
- Express Route Circuits
- Express Route Gateways
- Express Route Ports
- Azure Firewalls
- Application Gateways
- Load balancers
- Virtual Networks
- Virtual Network Gateways
- Log Analytics workspaces
- Private DNS zones
- Azure Key Vaults
- Virtual Machine
- Service health
For more details check out the Azure Monitor Baseline Alerts project.
Architecture
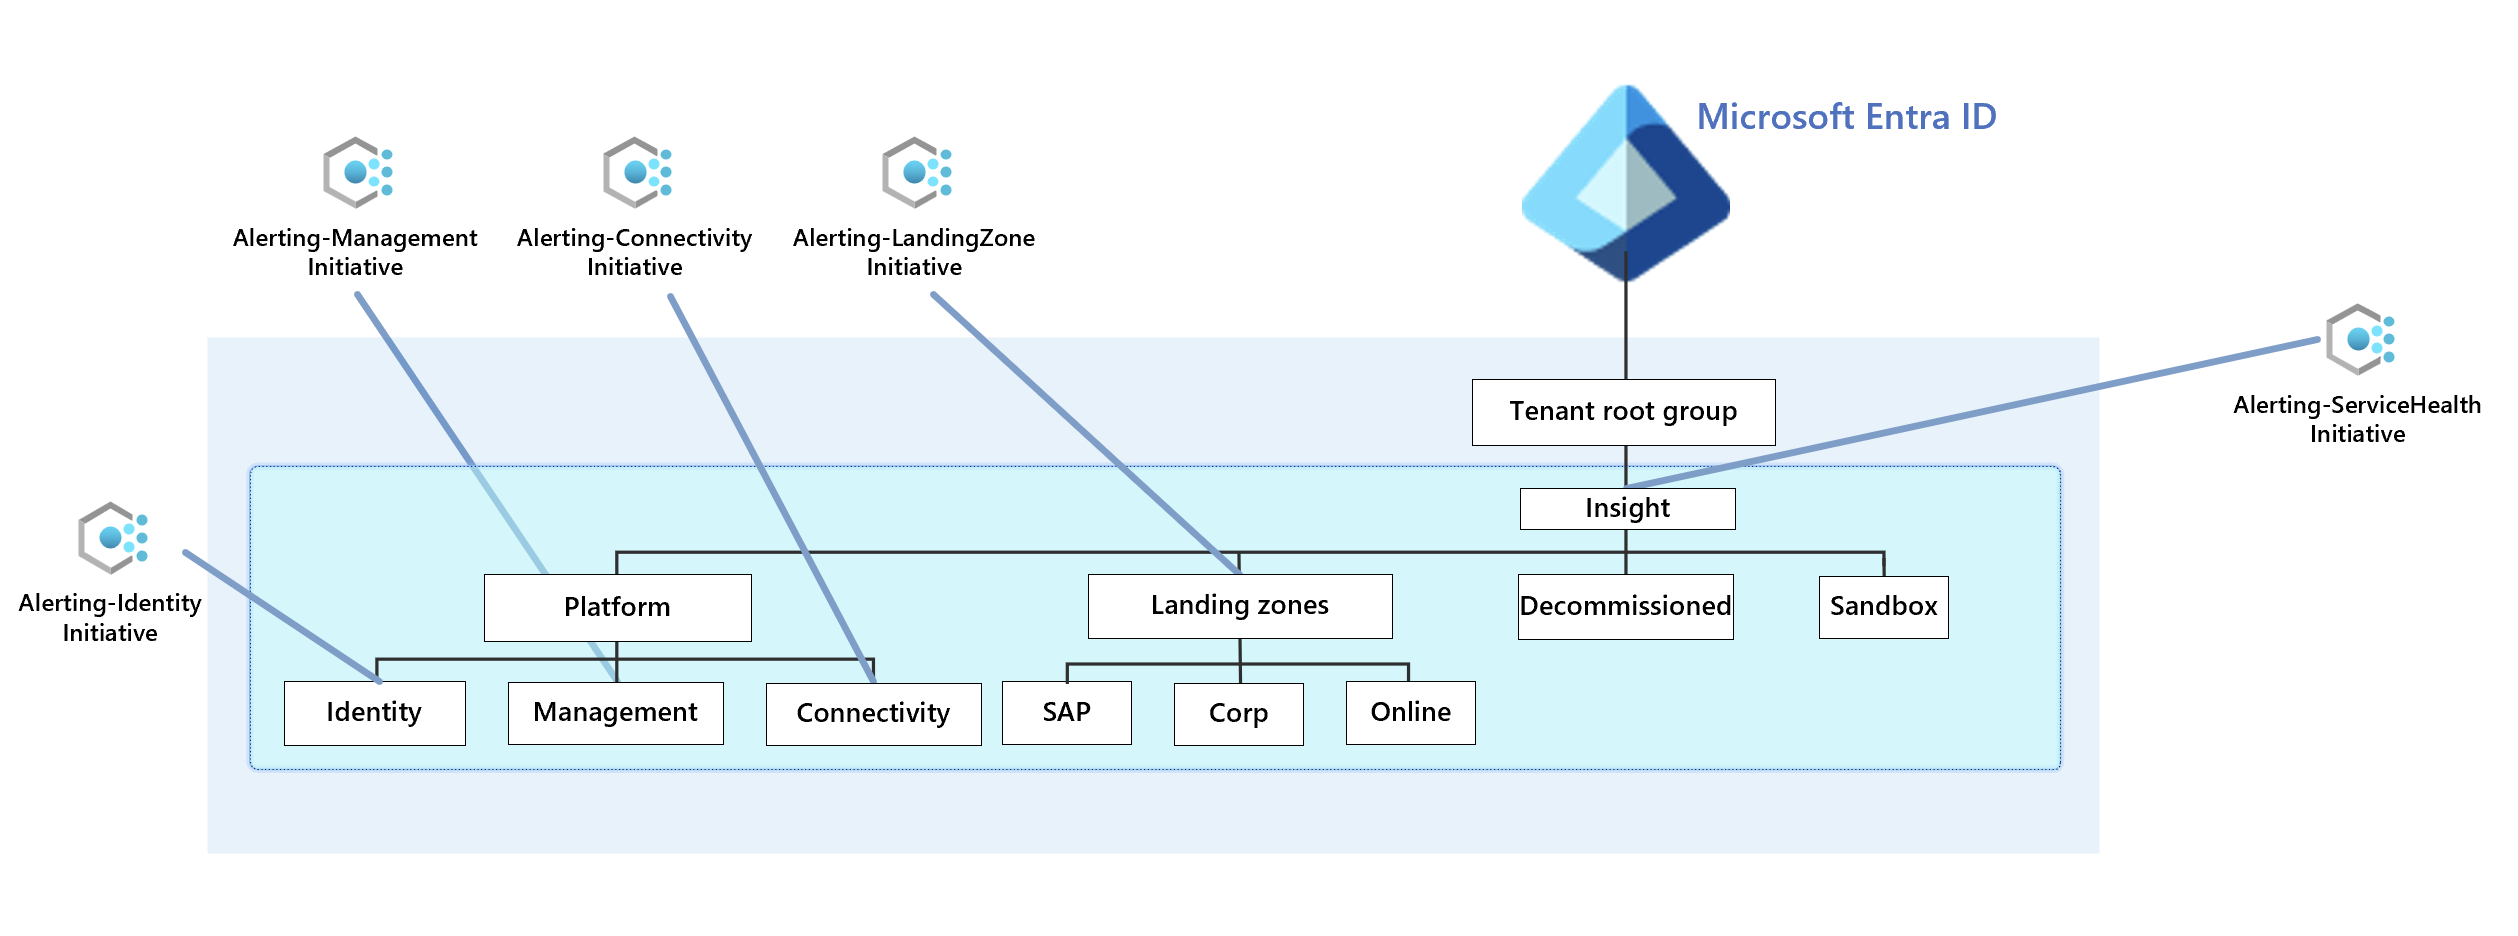
The AMBA for Azure Landing Zones leverages Azure Policy and the DeployIfNotExist effect across the various platform resources are grouped into Azure Policy initiatives and the associated assignments that are applied at the various Management Group levels.

The Policy Initiatives include:
- Platform Connectivity Initiative: Alerting & thresholds for all Platform Connectivity Azure resources, applied at the Platform Connectivity Management Group.
- Platform Management Initiative: Alerting & thresholds for all Platform Management Azure resources, applied at the Platform Management Management Group.
- Platform Identity Initiative: Alerting & thresholds for all Platform Identity Azure resources, applied at the Platform Identity Management Group.
- Service Health Initiative: Service Health alerts for each Azure Landing Zone, applied at the intermediate root Management Group.
- Landing Zones Initiative: Alerting & thresholds for all Landing Zone Azure resources, applied at the Landing Zone Management Group.
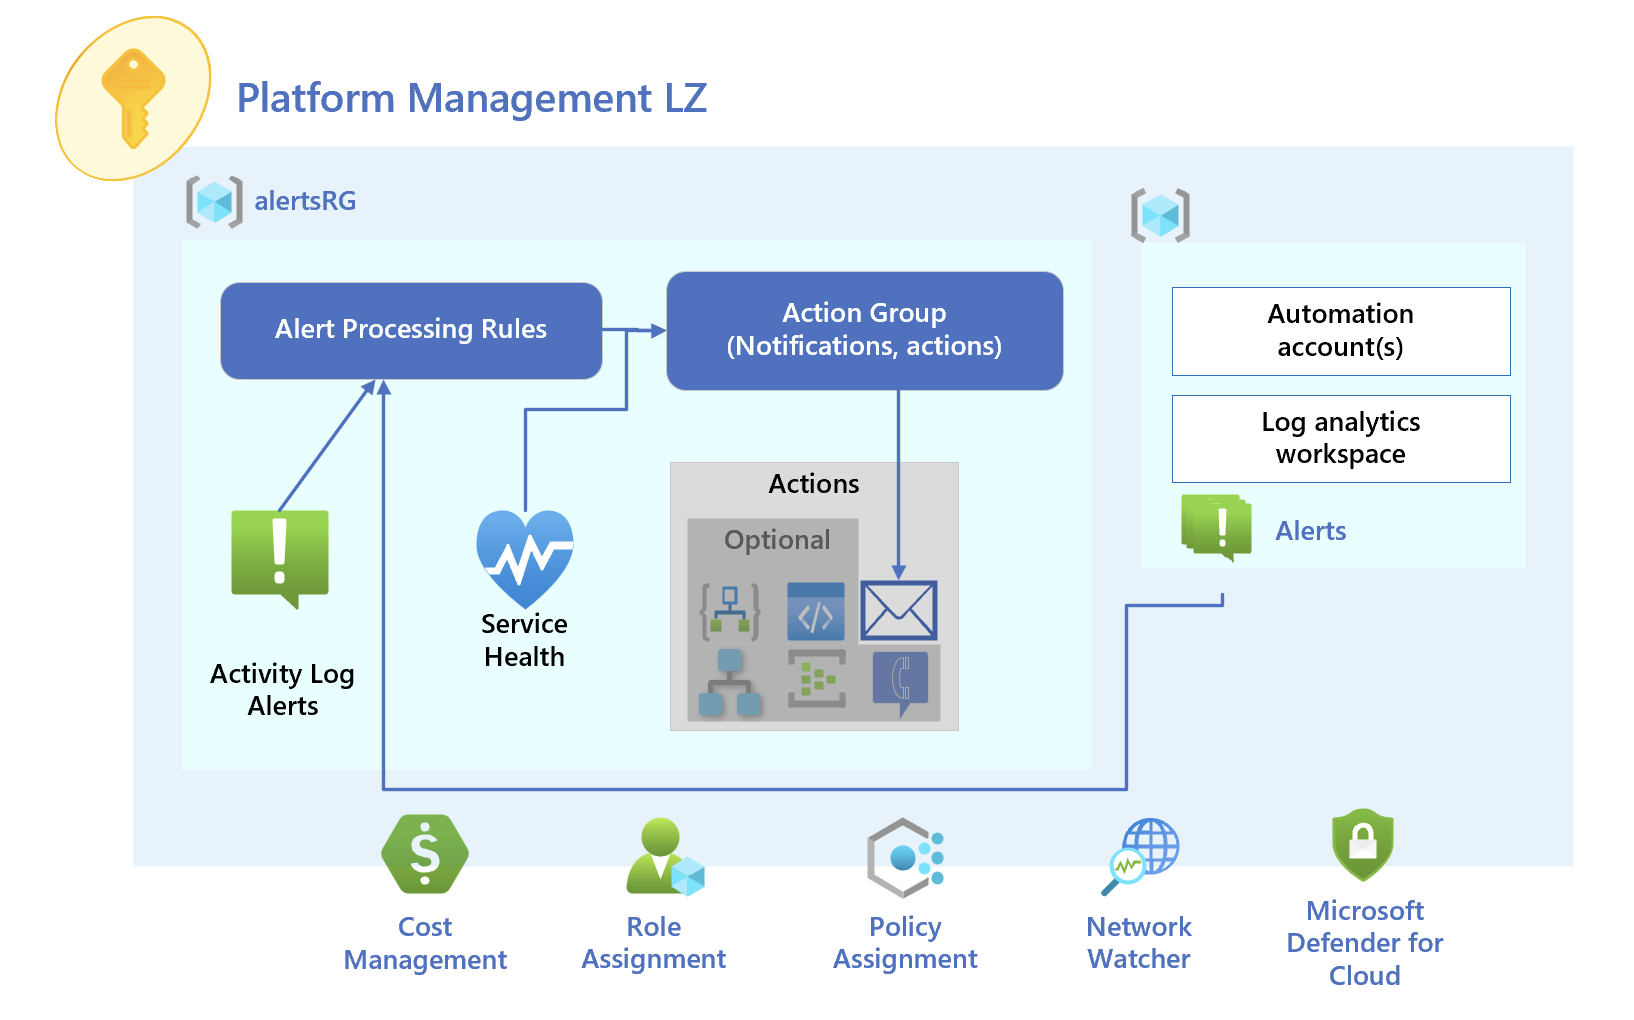
If we have a look at the deployment for the Platform Management Landing Zone we will have the following:

- Activity Log Alerts are aggregated at the subscription level and will be deployed to a common resource group within the Landing Zone (alertsRG) and will be for things like Route Tables, NSGs, etc.
- Service Health Alerts are aggregated at the subscription level and will be deployed to a common resource group within the Landing Zone (alertsRG) and will be for Service Health alerts within the Landing Zone.
- Resource Log Alerts are aggregated to the resource group that the resources are in and these can be things like Azure Automation accounts and Log Analytics Workspaces.
Conclusion
Like any of Open Source project, it is evolving and there are regular contributions to extend this framework and add further content, especially around visualizations for example. The Insight Platform Engineering team has taken an Inner Source approach to this and built on the project to add in specifics and IP that we leverage for customers, while still helping contribute to the Open Source community.
By implementing AMBA, we are embedding observability into Azure Landing Zones so that teams can proactively detect and resolve issues, leading to improved system reliability and a better user experience for all.