Effortlessly Create Mermaid Diagrams with GitHub Copilot
Author:
Daniel Fang
Published: March 20, 2024
8 minutes to read
Introduction
In today’s fast-paced development environment, visualizing workflows and processes can significantly enhance understanding and communication. Mermaid, a popular diagramming and charting tool, allows developers to create easy-to-read and maintainable diagrams using a simple markdown-like syntax. However, manually writing Mermaid diagrams can be time-consuming and prone to errors.
In this blog post, we will explore how to use GitHub Copilot to automatically produce Mermaid diagrams based on text descriptions. By following a few simple steps, you can streamline the process of creating diagrams, making your documentation more readable and maintainable.
What is needed?
Mermaid and GitHub Copilot can work together to generate diagrams automatically.
Mermaid
Mermaid is designed to simplify the process of creating diagrams and visualizations using a text-based syntax. Whether you need to create flowcharts, sequence diagrams, Gantt charts, or state diagrams, Mermaid allows you to define these visual elements in a straightforward and readable format. This makes it an excellent choice for developers and technical writers who want to enhance their documentation with clear and maintainable diagrams without the need for complex graphic design tools.
GitHub Copilot
GitHub Copilot is an AI-powered coding assistant developed by GitHub in collaboration with OpenAI. It leverages advanced machine learning models to understand natural language descriptions and generate relevant code snippets, making it an invaluable tool for developers. By integrating seamlessly into popular code editors like Visual Studio Code, GitHub Copilot can assist with a wide range of programming tasks, from writing boilerplate code to generating complex algorithms. This powerful assistant can significantly boost productivity and streamline the development process.
GitHub Copilot Chat
GitHub Copilot Chat is an extension of the GitHub Copilot experience, designed to provide an interactive and conversational interface for developers. By integrating directly into your development environment, GitHub Copilot Chat allows you to ask questions, get code suggestions, and receive explanations in real-time. This conversational approach makes it easier to understand complex code, debug issues, and explore new programming concepts.
Install Visual Studio Code Extensions
Let’s start with installing a few extensions so as to utilize the AI-assisted coding capabilities of GitHub Copilot, the interactive chat features of GitHub Copilot Chat, and the diagram generation features of Mermaid within Visual Studio Code
GitHub Copilot Extensions
Search GitHub Copilot in the Visual Studio Code extensions tab.
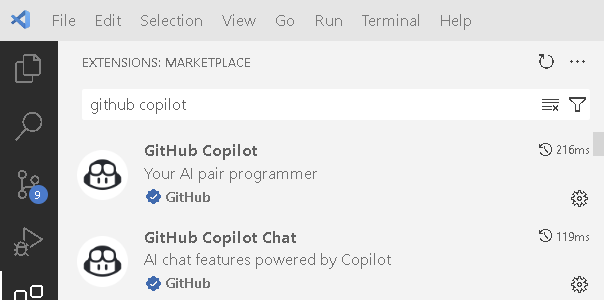
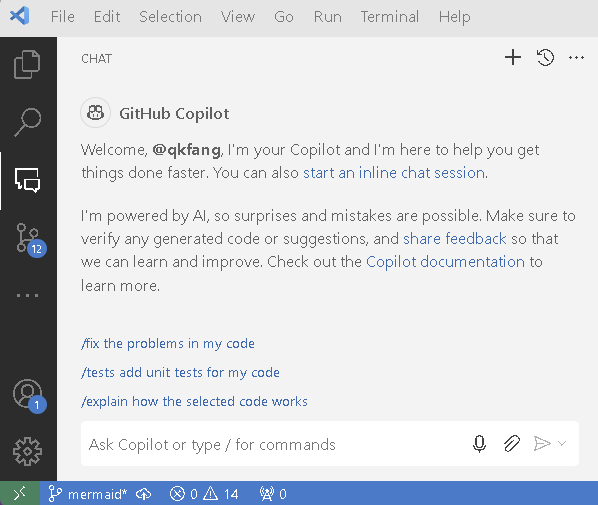
Install both above 2 extensions into Visual Studio Code and sign in with your GitHub account. Then you should now see a new chat icon on the left, this will bring up the chat interface.
Mermaid Extensions
To view Mermaid diagram in VS Code, you need to install an extension to preview the diagram. Markdown Preview Mermaid Support. Or you can use the official Mermaid plugin with Mermaid account.

Create Mermaid Diagram by GitHub Copilot
A clean, descriptive diagram is essential for visualizing your application’s logic in any project. Manually creating such diagrams, however, can be time-consuming and tedious. Thankfully, GitHub Copilot can assist in generating diagrams markdown based on text, simplifying the process.
Now, it’s time to walk through the steps to generate a Mermaid diagram.
Describe workflow in text format
For example, below is a block of text showing a simple integration using Azure API Management and Logic App / Function App.
Receive API call from [APIM]
[APIM] forwards request to [Logic App]
[Logic App] process the payload and save the payload to [SQL Server]
[Logic App] also save the payload to [Storage Account]
[Function App] pulls data from [SQL Server]
[Function App] then send updated records to [Service Bus]
Prepare the prompt for Copilot
To use copilot, we will define the task in the beginning of the prompt, then attach the workflow description next. Our prompt could be in below format.
Generate below actions in Mermaid markdown as interaction diagram

Receive API call from [APIM]
[APIM] forwards request to [Logic App]
[Logic App] process the payload and save the payload to [SQL Server]
[Logic App] also save the payload to [Storage Account]
[Function App] pulls data from [SQL Server]
[Function App] then send updated records to [Service Bus]
In Visual Studio code, go to the GitHub Copilot chat tab, and copy above text into the chat.
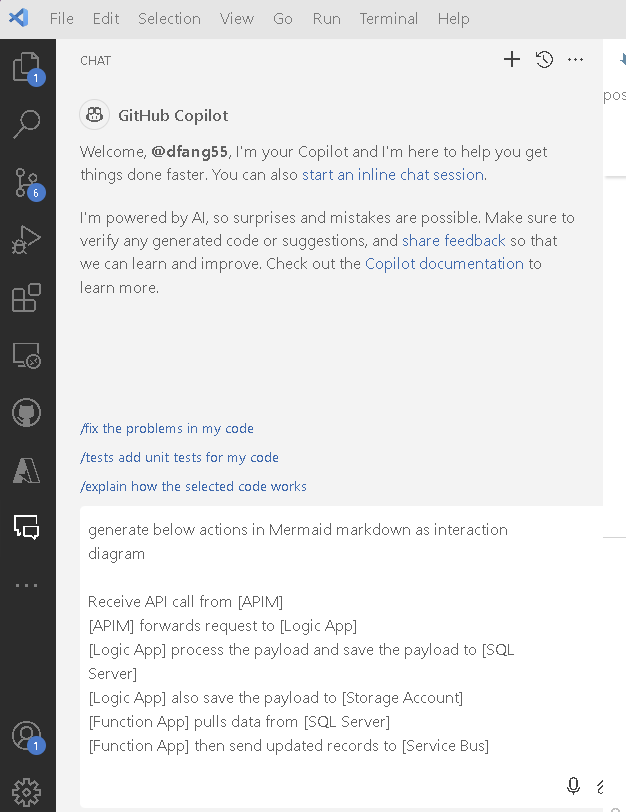
Checkout the chat response
Hooray, we got a clean Mermaid markdown back! It is all in text format but once we copy it into a markdown file, the block of Mermaid markdown will be displayed as a diagram.
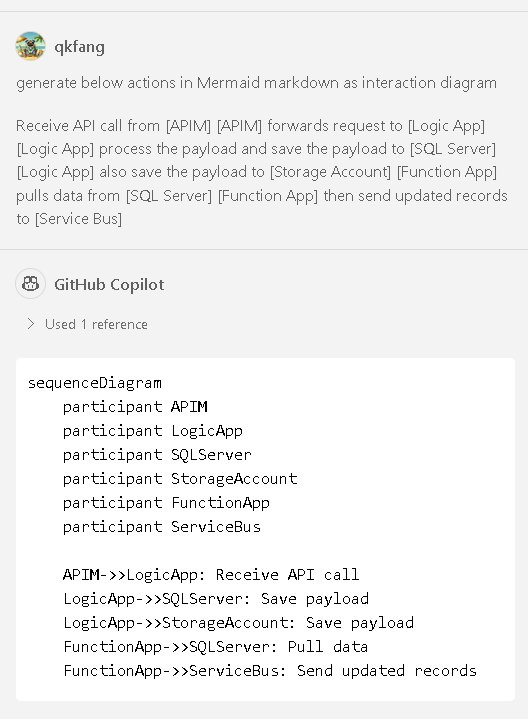
Below is the text format for the above chat response.
sequenceDiagram
    participant APIM
    participant LogicApp
    participant SQLServer
    participant StorageAccount
    participant FunctionApp
    participant ServiceBus

    APIM->>LogicApp: Receive API call
    LogicApp->>SQLServer: Process and save payload
    LogicApp->>StorageAccount: Save payload
    FunctionApp->>SQLServer: Pull data
    FunctionApp->>ServiceBus: Send updated records
View Mermaid Markdown
Now, we can have a close look at the generated markdown, and see how it is presented in the Visual Studio Code. Add a block for Mermaid markdown in your .md file, and copy the chat response into the Mermaid block like below. Make sure the Mermaid markdown is surrounded by [mermaid] tag.
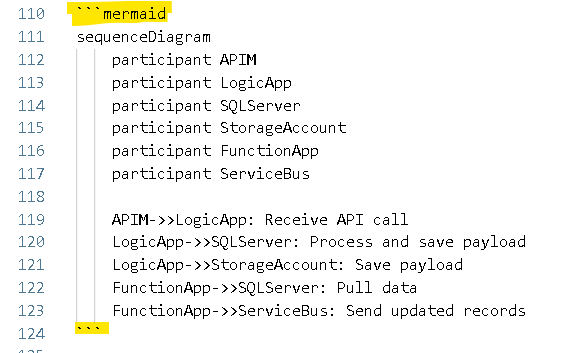
Cool! We have created the sequence flow within 2 minutes! Let’s check if workflow steps and logics look correctly.
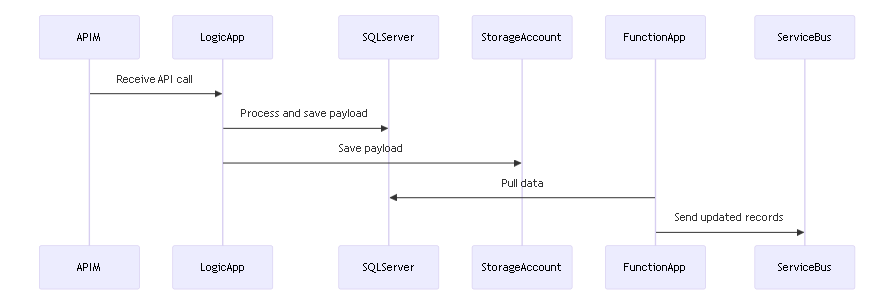
Pretty accurate representation of our workflows above. All key components are displayed together with direction of data flow.
Explore Other Mermaid Diagram Types
There are rich set of Mermaid diagram types, below are some examples.
Flowchart Diagram
Here is an example of Flowchart.
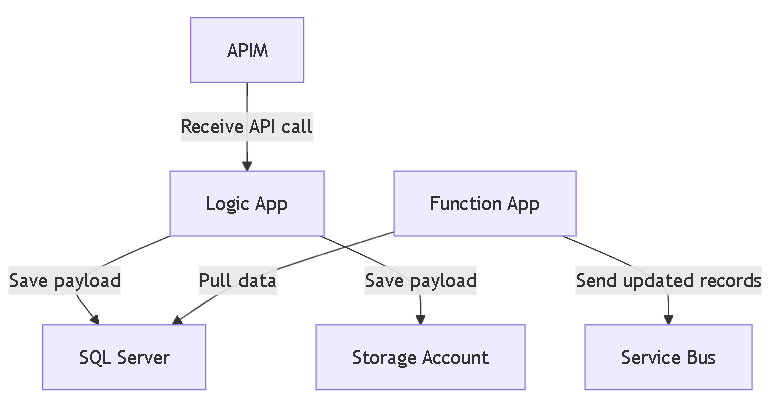
Generated Mermaid markdown below from GitHub Copilot:
flowchart TD
    APIM[APIM] -->|Receive API call| LogicApp[Logic App]
    LogicApp -->|Save payload| SQLServer[SQL Server]
    LogicApp -->|Save payload| StorageAccount[Storage Account]
    FunctionApp[Function App] -->|Pull data| SQLServer
    FunctionApp -->|Send updated records| ServiceBus[Service Bus]
Gantt Diagram
Here is an example of Gantt chart.
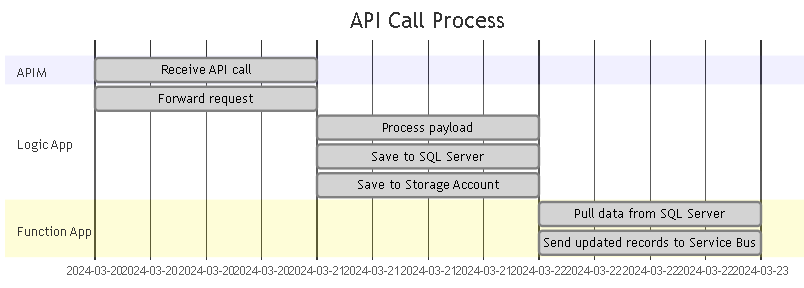
Generated Mermaid markdown below from GitHub Copilot:
gantt
    title API Call Process
    dateFormat  YYYY-MM-DD
    section APIM
    Receive API call       :done, 2024-03-20, 1d
    section Logic App
    Forward request        :done, 2024-03-20, 1d
    Process payload        :done, 2024-03-21, 1d
    Save to SQL Server     :done, 2024-03-21, 1d
    Save to Storage Account:done, 2024-03-21, 1d
    section Function App
    Pull data from SQL Server :done, 2024-03-22, 1d
    Send updated records to Service Bus :done, 2024-03-22, 1d
State Diagram
Here is an example of State chart.
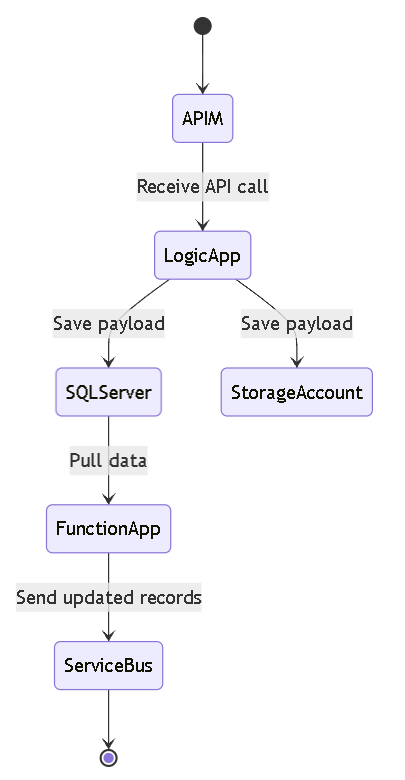
Generated Mermaid markdown below from GitHub Copilot:
stateDiagram-v2
    [*] --> APIM
    APIM --> LogicApp : Receive API call
    LogicApp --> SQLServer : Save payload
    LogicApp --> StorageAccount : Save payload
    SQLServer --> FunctionApp : Pull data
    FunctionApp --> ServiceBus : Send updated records
    ServiceBus --> [*]
Wrap up
Creating diagrams for your workflows is now super easy! With just a few simple steps, you can visually represent complex processes without the hassle of manual diagramming.
Even better, these Mermaid diagrams can be seamlessly integrated into your source control system. This not only ensures your diagrams are version-controlled alongside your code but also makes future updates and modifications straightforward. As your workflows evolve, you can easily keep your visual documentation up to date, making it a breeze to maintain clarity and consistency throughout your project.